Picture this: You’re sipping your coffee, scrolling through your Google Ads dashboard, wondering how you’re really doing compared to your competitors. Sure, your ads are live, impressions are rolling in—but are you winning?
That’s where the Google Ads Auction Insight Report comes in. Think of it as a backstage pass to the advertising arena, revealing who’s bidding on the same keywords, how visible your ads are, and who’s outranking you.
Let’s dive into how it works, what metrics matter, and how to use it to your advantage.
What is the Google Ads Auction Insight Report?
Every time someone searches on Google, an ad auction happens in milliseconds. The Auction Insight Report gives you a sneak peek into that action—how your ad stacks up against others targeting the same audience, basically your competition.
In simple terms: it tells you who you’re really competing with, how often you’re visible, and where you rank in those micro-moments of the search engine battle.
Key Metrics That Matter (And What They Actually Mean)
Understanding the Auction Insight report starts with mastering these six metrics:
1. Impression Share
How often your ad appears versus how often it could have. If your impression share is 65%, that means your ad showed in 65 out of every 100 auctions it was eligible for. This gives you an idea of how much “market share” you have compare to your competitors.
Low Impression Share? You might be limited by budget or ad rank. To know what is limiting you, add the following columns to your Campaigns Tab view:
- Search lost impression share (rank)
- Search lost impression share Top (rank)
- Search lost impression share abs. Top (rank)
- Search lost impression share (budget)
- Search lost impression share Top (budget)
- Search lost impression share abs. Top (budget)
2. Overlap Rate
This shows how often another advertiser’s ad appeared when yours did. A 90% overlap rate? That competitor is tailgating you hard.
Use Case: Spot top competitors who keep showing up in your space.
3. Outranking Share
This metric shows how often your ad beat another advertiser’s in the same auction—or showed when theirs didn’t at all.
Higher share = you’re dominating the auctions.
4. Position Above Rate (Search only)
How often your competitor’s ad showed above yours when both were triggered.
High rate = They’re consistently outranking you.
5. Top of Page Rate
What percentage of your impressions showed above the organic search results.
Important for visibility, especially on mobile where the top slots rule.
6. Absolute Top of Page Rate
This tells you how often your ad was the very first one on the page.
It’s like the billboard on the digital highway—prime real estate!
How to Access the Auction Insights Report
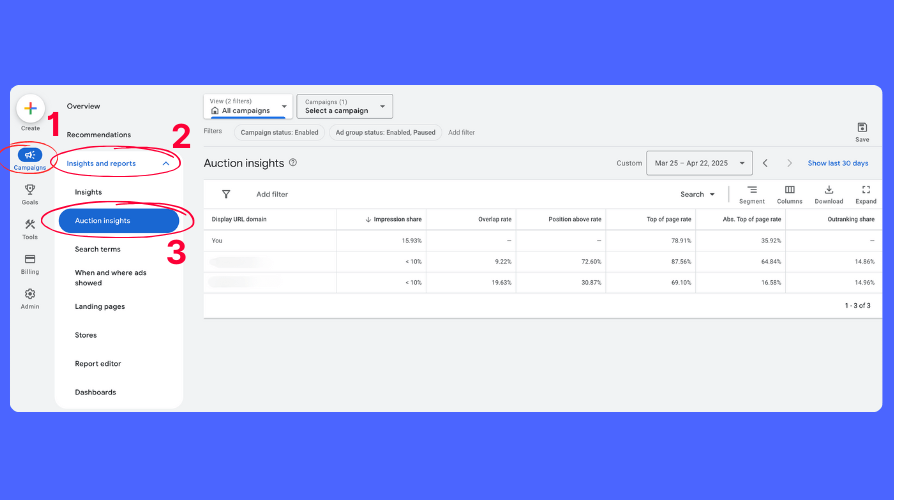
Getting this info is easier than you think, first Log into your Google Ads account, then:
- Go to the Campaigns tab
- Click on Insights and reports
- Select Auction insights at the top.
Voilà! You’ve just unlocked valuable competitive data.
💡 Pro Tip: Compare reports weekly, monthly, or quarterly to spot trends.
How to Actually Use These Insights
Knowing the metrics is cool. But knowing what to do with them? That’s where the magic happens.
Scenario Breakdown:
Let’s say you run Google Ads for a dental clinic in Miami.
-
Your Impression Share: 48%
-
Competitor A’s Impression Share: 85%
-
Position Above Rate (Competitor A): 72%
-
Your Outranking Share: 30%
🚨 Translation: They’re eating your lunch.
Your possible next moves?
-
Raise budget during peak hours – based on your conversion data, when is peak hour for you?
-
Refresh ad copy to be more engaging and unique. Your quality score might be lower than your competitor and therefore get less exposure than then. Have also a look at your CTR.
-
Improve landing page experience to boost Quality Score even further.
- Check your Keywords, you migh be targeting keywords that are not relevant to your campaigns, eating up your budget, not allowing your ads to be relevant and therefore penalizing you in the auction.
To give you a good idea of where you are lacking strengh, check the columns we mentioned earlier in the article:
- Search lost impression share (rank)
- Search lost impression share Top (rank)
- Search lost impression share abs. Top (rank)
- Search lost impression share (budget)
- Search lost impression share Top (budget)
- Search lost impression share abs. Top (budget)
These will let you know if your budget or rank (quality score) is the issue.
Strategic Tweaks to Beat the Competition
Here’s how to respond like a Google Ads pro:
-
Raise Bids Strategically: Focus on keywords where you’re consistently being outranked. Learn more on how to search and find the best keywords for your niche.
-
Refresh Creatives: Update your headlines, CTAs, and visuals to grab attention. We have a guide on how to improve your copywriting for your google ads.
-
Geo-Target Smarter: Focus on ZIP codes with higher conversion rates.
-
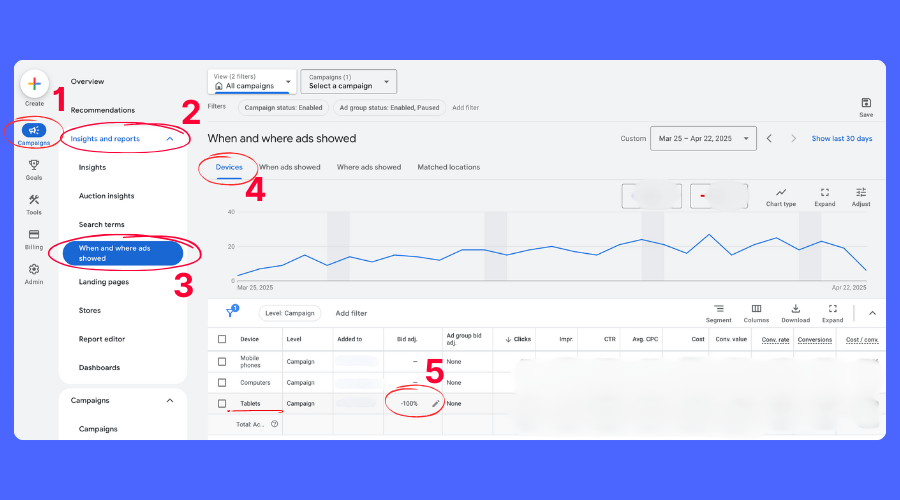
Optimize for Device: If mobile performs best, increase bids there. And by the way, we recommend you alway disable ads on Tablets as they usually offer the lowest performances. To do so, after login to your Google Ads account, follow these simple steps:
- Go to the Campaign tab
- Click on Insights and reports
- Select When and where ads showed
- Click on Devices
- Under the Bid Adjustement column, for Tablets, click on the pen and Decrease the bid by 100%
Common Mistakes to Avoid
-
Ignoring the report altogether 😬
-
Making reactive changes without a plan
-
Misreading Overlap Rate as a threat every time
-
Changing too many variables at once (keep tests controlled)
When Should You Check the Auction Insight Report?
-
After a performance dip
-
During holiday seasons
-
After launching a new campaign
-
If you see sudden drops in CTR
-
After budget or targeting changes
Basically—if something feels off, check the report first.
Auction Insight in Performance Max & Smart Campaigns
Bad news: You can’t view direct Auction Insights in Performance Max campaigns.
Good news: You can still get indirect signals from:
-
Asset group performance
-
Search term insights
-
Demographic/geographic performance
For Smart Campaigns, consider upgrading to Search campaigns for full control.
Tools That Work Well With Auction Insights
Pair Auction Insight with these tools for max results:
-
SEMrush / SpyFu – Competitor keyword research
-
Google Trends – Timing is everything
-
Google Ads Editor – Bulk changes made easy
-
Looker Studio – Visualize Auction data over time
-
Ad Preview Tool – Test ad appearance without affecting CTR
Final Thoughts: From Guesswork to Growth
Google Ads isn’t just about throwing up some keywords and hoping for clicks. It’s a live competition—and the Auction Insight Report is your scoreboard.
Use it to:
-
Spot opportunities
-
Outmaneuver competitors
-
Drive better ROI
In digital advertising, knowledge is power—and Auction Insights is your ultimate intel. We have a couple of very helpful guides on how to run google ads for beginners, in depth more advanced google ads guide, how to structure your campaigns, how to handle competitors and how to use smart and manual bidding.
FAQ – How to understand Google Ads Auction Report
Can I use Auction Insights for all campaign types?
Is a low Impression Share always bad?
Not necessarily—it may mean focused targeting or limited budget.
What if a new competitor pops up suddenly?
Check their position, adjust your strategy, and audit your ad relevance.
How often should I check the report?
Weekly for high-activity campaigns. Monthly for evergreen ones.
Can I export the data?
Yep—just click the Download button.
Does a high Overlap Rate mean they’re beating me?
Not always. It just means you’re often in the same auctions. Check Position Above Rate for the full story.


